Assistant Professor Zahra Shakeri teaches the Health Data Visualization course (HAD7001H-S2) at IHPME and is the principal investigator of the Health Informatics, Visualization, and Equity (HIVE) Lab. Both the data visualization course and the HIVE Lab are welcome additions to IHPME, as they will afford our students the ability to gain new skills and our researchers will have access to a new way of presenting their data, leading to improved storytelling.
Data visualization has always been a pivotal component of her research projects that delve into data-intensive fields, such as machine learning and digital public health surveillance. The visualization techniques included in her educational framework are derived from her experience of working with a diverse range of data types and scales, as well as the challenges she has encountered while attempting to visualize each scenario.
Communicating research results is just as important as the research itself. It is essential to use language that all stakeholders, including end-users and the public, can easily understand. Effective and accurate data visualization can close the gap between research teams and stakeholders who lack background information about the project, increasing its impact. At HIVE Lab, we aim to enhance the skills of information visualization and data-driven storytelling within our department and the school, which will foster increased collaboration and raise the visibility and impact of research conducted within the school.”
~ Dr. Zahra Shakeri
What the lab offers…
- It focuses on the intersection of public health, precision health, AI, data science, and information visualization. The goal is to make a meaningful impact by exploring the intersections of these fields and leveraging the latest advancements to drive positive outcomes.
- It brings together cutting-edge technology and expertise in data analysis to tackle some of the most pressing public health challenges of our time.
- With a focus on information visualization, the lab’s team is dedicated to creating innovative and intuitive solutions that make complex data more accessible and understandable to a wider audience. They believe that the visual representation of data is a powerful tool that can help unlock insights, foster collaboration, and drive decision-making.
The HIVE Lab improves storytelling by…
- Enhancing communication of research findings for researchers at IHPME, DLSPH, and U of T by enabling them to effectively convey their research to a wider audience, such as the public, government officials, and policy makers.
- Facilitating informed decision-making for policy makers by providing them with access to trends and patterns that may be difficult to detect through raw and complex data.
- Improving the dissemination and communication of research findings for researchers in our school by providing them with the tools to create high-quality illustrations and interactive dashboards to supplement their publications.
- Fostering collaborations and information sharing between IHPME, DLSPH, and U of T’s researchers and other institutions, organizations, or disciplines.
Q&A with Dr. Shakeri
What led to your work in this area?
“I have been incredibly fortunate to collaborate with exceptional colleagues and mentors who helped me fully grasp the true significance of this educational framework. I had the extraordinary opportunity to work as a research fellow at Dr. Gehlenborg’s lab at Harvard Medical School, where I was able to learn from one of the world’s premier research teams in the field of data visualization. The constant positive feedback we received from our collaborators on the impact of these high-quality visualizations on the dissemination and communication of their research products convinced me to expand the scope of this education component from EHR data to a broader context of public health and patient-level data, and to make the tutorials more concrete and illustrative, to ensure a wider group of researchers and practitioners can benefit from these modules.”
How has this work impacted your research/teaching?
“Data visualization has always been a pivotal component in my research projects that delve into data-intensive fields, such as machine learning and digital public health surveillance. The visualization techniques included in this educational framework are derived from my experience of working with a diverse range of data types and scales, as well as the challenges I encountered while attempting to visualize each scenario.
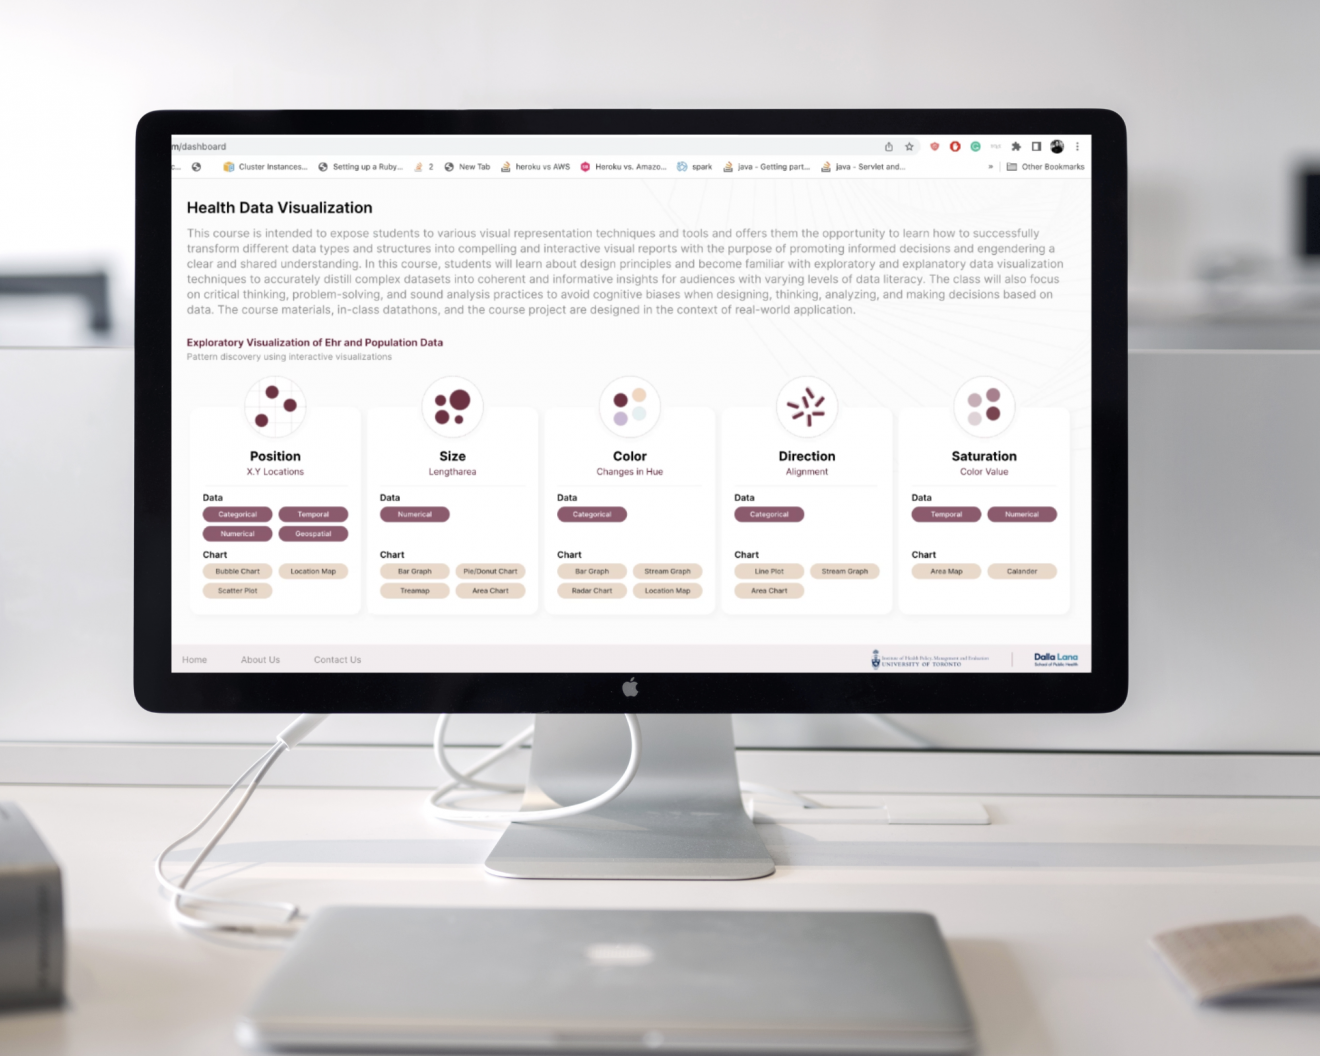
This framework offers numerous advantages for students who have taken the Health Data Visualization course. The clear and succinct step-by-step instructions provided for each visualization technique can greatly aid in simplifying the learning process for new programming languages or platforms. Additionally, students will be exposed to over 50 visualization techniques using three different platforms (R, Python, Tableau) and real-world public health and EHR datasets, preparing them to effectively visualize data from various contexts, types, and complexity levels.
Additionally, this platform will provide students with ongoing access to a vast array of visualization techniques and their implementation, enabling them to smoothly transition between various concepts covered in the course, without the need to constantly refer to their lecture notes or files.”
What is next?
“We are hoping that by collaborating with other research groups and public health stakeholders, we can enhance and refine our educational framework. These partnerships will enable us to better understand the needs of our audience and tailor our learning modules accordingly. Additionally, we will have the chance to gain insights from industry experts, ensuring that our framework is as impactful as possible.
Our objective is to broaden the scope of the educational component and integrate more advanced data-science techniques essential for executing a comprehensive data science pipeline for EHR-based and public health projects. Additionally, we aim to incorporate applied machine learning for public health, establish nationwide federated machine learning infrastructure, and generate pre-trained models for various domains within public health utilizing heterogeneous data sources. These augmentations will significantly enhance the efficacy of our educational platform and facilitate the progression of public health research.”
Students interested in taking the the Health Data Visualization course (HAD7001H-S2) at IHPME are encouraged to visit the course page on our website.


Sign up for IHPME Connect.
Keep up to date with IHPME’s News & Research, Events & Program, Recognition, e-newsletter.
Subscribe to Connect Newsletter
Get in Contact
Communications
Marielle Boutin
Email Address: ihpme.communications@utoronto.ca